Let’s be honest: developing for WordPress without proper debugging tools is like driving a car blindfolded. You might get where you’re going, but you’re probably going to hit a few things along the way. Whether you are battling the White Screen of Death (WSOD) or trying to figure out why a specific page takes five seconds to load, you need X-ray vision into your code.
Enter the Query Monitor WordPress plugin.
While tools like WP_DEBUG are essential, they are often blunt instruments. Query Monitor is the surgical scalpel in a developer’s toolkit. In this comprehensive guide, we will deep dive into why this plugin is non-negotiable for serious development, how to set it up, and how to use it to optimize your themes and plugins effectively.
What is the Query Monitor WordPress Plugin?
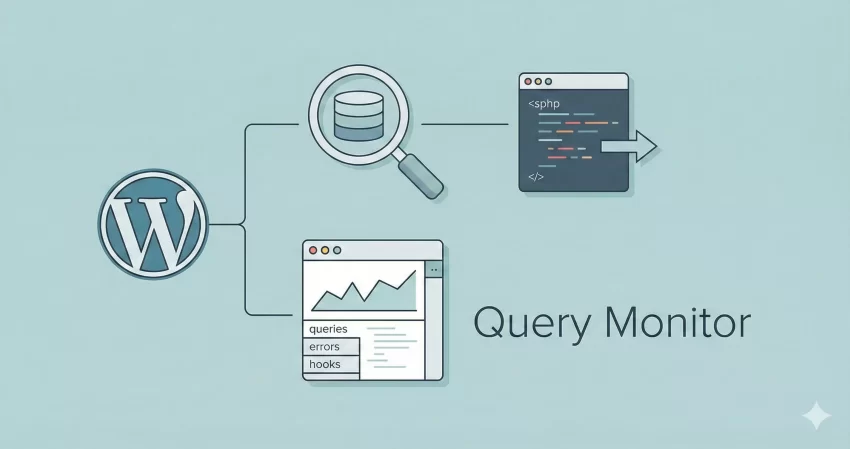
Query Monitor is a free debugging and development panel for WordPress. Unlike standard logs that you have to dig through via FTP, the Query Monitor WordPress tool presents data in a user-friendly overlay directly on your front end and admin bar. It allows developers to identify problematic plugins, inefficient database queries, and PHP errors in real-time.
Why It Beats Other Debugging Tools
- Granular Database Insight: It doesn’t just count queries; it shows you exactly which code triggered them.
- HTTP API Requests: See external calls that are blocking your page load.
- Hook & Action Inspection: Visualize the order of events firing on your page.
- AJAX Debugging: A notoriously difficult thing to debug, made simple.
Installing and Accessing the Console
Getting started is straightforward. Navigate to Plugins > Add New and search for “Query Monitor.” Install and activate the plugin authored by John Blackbourn.
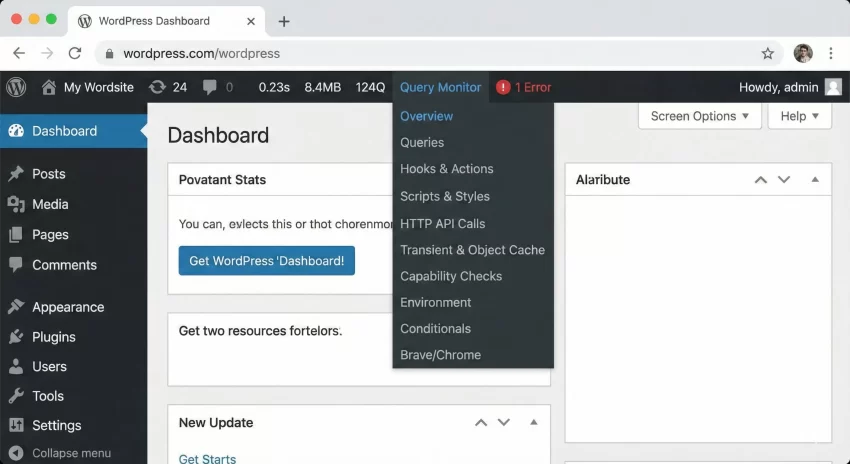
Once activated, you won’t see a settings page. Instead, look at your top Admin Bar. You will see a new collection of statistics (usually time for page generation, memory usage, and generic query time). Hovering over this reveals the magic.
Core Features: How to Debug Like a Pro
To truly master the Query Monitor WordPress workflow, you need to understand the data it provides. Let’s break down the most critical panels.
1. Database Queries (The Performance Killer)
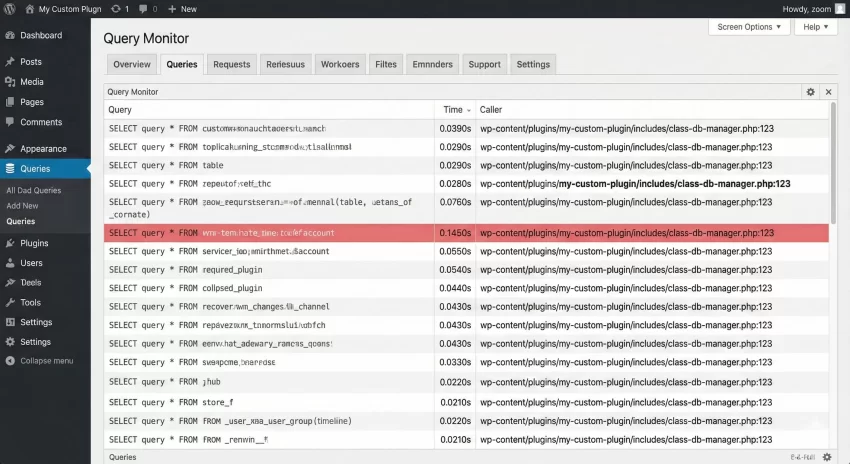
This is arguably the most important feature. The “Queries” panel allows you to see every single SQL query executed during the page load.
What to look for:
- Duplicate Queries: Are you querying the same post meta 50 times in a loop?
- Slow Queries: Query Monitor highlights slow queries in red. These are your optimization targets.
- Caller: This column tells you the exact function and component (Plugin or Theme) responsible for the query.
If you see a plugin generating 500+ queries on a simple page, you have found your bottleneck.
2. PHP Errors in Real-Time
Forget checking debug.log every two minutes. The Query Monitor WordPress interface catches PHP warnings, notices, and strict standard errors and displays them neatly. It groups them by component, so you know immediately if your custom theme or a third-party plugin is throwing the error.
3. HTTP API Calls
Is your site hanging for 3 seconds before loading? It’s often an external API call (like checking for plugin updates or fetching a Twitter feed) that has timed out. Query Monitor logs all wp_remote_get and wp_remote_post requests, showing you the response code and the time taken.
Advanced Development: Adding Custom Logging
For developers building complex solutions, simply viewing automatic logs isn’t enough. Sometimes you need to log your own data variables without var_dump breaking your layout. Query Monitor allows you to send custom logs to its panel.
However, you should always code defensively. You don’t want your site to crash if Query Monitor is deactivated. Here is a helper function you can drop into your functions.php file. Note that we are using the prefix pnet_ to ensure no conflicts.
/**
 * Safely log data to Query Monitor.
 *
 * @param mixed  $data     The variable to log.
 * @param string $type     The log level (info, warning, error).
 */
function pnet_log_to_qm( $data, $type = 'info' ) {
    // Check if Query Monitor is active
    if ( ! defined( 'QM_VERSION' ) ) {
        return;
    }

    // Map custom types to Query Monitor methods
    switch ( $type ) {
        case 'warning':
            do_action( 'qm/warning', $data );
            break;
        case 'error':
            do_action( 'qm/error', $data );
            break;
        default:
            do_action( 'qm/info', $data );
            break;
    }
}

// Example Usage:
$user_id = get_current_user_id();
pnet_log_to_qm( 'Current User ID is: ' . $user_id );
Now, inside the Query Monitor panel, you will see a “Logs” tab containing your custom variables. This is cleaner and more professional than printing arrays to the top of the browser window.
You might also like:

Debugging AJAX with Query Monitor
Debugging AJAX is historically painful because the response is hidden in the network tab. The Query Monitor WordPress plugin solves this by capturing headers sent during AJAX requests.
When an AJAX call fires, the Query Monitor icon in the admin bar will update. It keeps a history of recent requests. By clicking on a specific request, you can view the PHP errors and SQL queries specifically associated with that AJAX call, separate from the main page load.
Targeting the “Caller” Component
One of the most underused features is the “Component” filter. If you are developing a specific plugin, you can filter the output to show only issues related to your code.
- Open the Queries or Hooks panel.
- Look for the “Component” dropdown filter at the top.
- Select your theme or plugin name.
This filters out the noise from WordPress core and other plugins, allowing you to laser-focus on your own development work.
Conclusion
Speed and stability are not accidents; they are the result of careful debugging and optimization. The Query Monitor WordPress plugin bridges the gap between guessing what is wrong and knowing exactly which line of code is responsible.
If you aren’t using it yet, install it today. It will not only save you hours of frustration but will also make you a better WordPress developer by exposing how WordPress operates under the hood.
Do you have a favorite debugging trick using Query Monitor? Let me know in the comments below!