There is nothing more terrifying for a website owner than the “White Screen of Death” or a critical error message preventing access to the dashboard. Whether you are developing a custom theme or managing a client’s site, PHP errors are inevitable. However, finding the root cause doesn’t have to be a guessing game. This is where WordPress Debug Mode becomes your best friend.
Mastering the debugging tools built directly into WordPress is the difference between spending hours blindly deactivating plugins and fixing the issue in minutes.
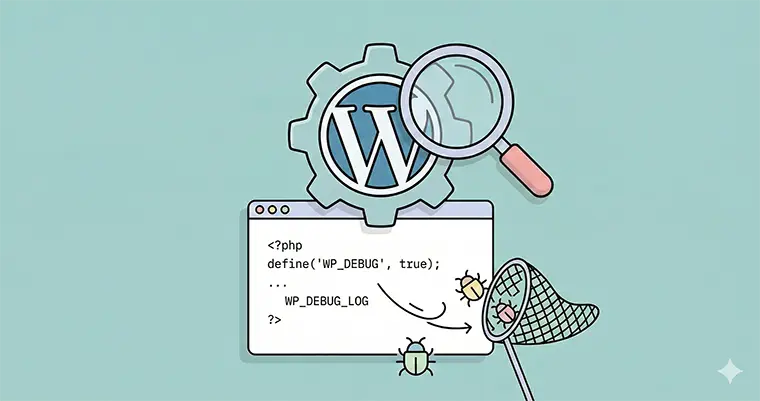
In this guide, we will move beyond the basics. We will explore how to professionally configure WordPress Debug Mode using WP_DEBUG, WP_DEBUG_LOG, and SCRIPT_DEBUG to hunt down fatal PHP errors without disrupting your site visitors.
What is WordPress Debug Mode?
WordPress Debug Mode is a built-in diagnostic tool intended to help developers identify code errors in the WordPress core, themes, and plugins. When enabled, it activates various PHP error reporting levels that are usually hidden to keep the site looking clean for visitors.
By default, WordPress suppresses these error messages. While this is great for a live site’s aesthetics, it is terrible for troubleshooting. Enabling WordPress Debug Mode forces the CMS to reveal exactly what is going wrong, pointing you to the specific file and line number causing the crash.
Before You Start: The Golden Rule
Before editing any core files, always create a backup of your wp-config.php file. This file controls your site’s database connection and configuration settings. One misplaced comma can take your site offline, so having a backup ensures you can restore access immediately.
How to Enable WordPress Debug Mode
To start the debugging process, you need to access your site files via FTP (File Transfer Protocol) or your hosting provider’s File Manager (cPanel).
- Locate the
wp-config.phpfile in your root directory (usuallypublic_html). - Open the file and scroll down until you see the line that says:
/* That's all, stop editing! Happy publishing. */ - Just above that line, you will likely see
define( 'WP_DEBUG', false );.
To enable WordPress Debug Mode, change false to true:
define( 'WP_DEBUG', true );
Once saved, if you reload your website, you will likely see error messages, warnings, and notices appear at the top of your pages. While this is helpful, displaying errors publicly on a live site looks unprofessional and can expose security vulnerabilities. This brings us to the “Master” level of configuration: Logging.
The Professional Setup: Using WP_DEBUG_LOG
For a live environment, you rarely want errors printed directly on the screen. Instead, you should configure WordPress Debug Mode to write these errors to a private log file. This allows you to review the errors behind the scenes while your visitors continue to see a standard page.
To do this, we need to use the WP_DEBUG_LOG and WP_DEBUG_DISPLAY constants together.
1. Save Errors to a File
Add the following line to your wp-config.php file:
define( 'WP_DEBUG_LOG', true );
This tells WordPress to save all error messages to a file named debug.log located inside the /wp-content/ directory.
2. Hide Errors from the Screen
Next, you want to prevent the errors from cluttering up your website’s layout. Add this line:
define( 'WP_DEBUG_DISPLAY', false );
This tells WordPress to hide the errors from displaying on website, still logging the errors in the debug.log file.
The Complete Code Snippet
Here is the standard code block you should use to master WordPress Debug Mode safely. Replace the existing define( 'WP_DEBUG', false ); line with this block:
// Enable WP_DEBUG mode
define( 'WP_DEBUG', true );

// Enable Debug logging to the /wp-content/debug.log file
define( 'WP_DEBUG_LOG', true );

// Disable display of errors and warnings
define( 'WP_DEBUG_DISPLAY', false );
define( '@ini_set', 'display_errors', 0 );
With this setup, your visitors see a normal site, while you can open /wp-content/debug.log to see a history of every PHP notice, warning, or fatal error occurring on the site.
Troubleshooting JavaScript with SCRIPT_DEBUG
Sometimes, the issue isn’t with PHP, but with the CSS or JavaScript running on your site. WordPress normally uses “minified” versions of these files (files with whitespace removed) to speed up loading times. However, debugging a minified file is nearly impossible.
This is where SCRIPT_DEBUG comes in. When you add this constant to your configuration, WordPress switches to using the full, non-minified versions of core CSS and JavaScript files.
define( 'SCRIPT_DEBUG', true );
If you are a developer trying to track down a conflict in the WordPress admin area or the block editor, adding this to your WordPress Debug Mode toolkit is essential.
Analyzing the Debug Log
Once you have WordPress Debug Mode enabled and logging active, reproduce the error on your site (e.g., reload the page that is crashing). Then, open your debug.log file.
You will see entries that look like this:
[23-Nov-2025 14:00:00 UTC] PHP Fatal error: Uncaught Error: Call to undefined function... in /home/user/public_html/wp-content/plugins/bad-plugin/index.php:45
This single line tells you:
- The Time: When the error happened.
- The Type: It is a Fatal Error (the script stopped).
- The Cause: A plugin named “bad-plugin.”
- The Location:
Line 45ofindex.php.
You now know exactly which plugin to deactivate or which line of code to fix.
Security Warning: When to Disable Debugging
While WordPress Debug Mode is a powerful tool, it is not meant to be left on permanently. The debug.log file can grow very large over time, eating up server space. More importantly, if a hacker guesses the location of your log file, they can read it to learn about your server directory structure and potential vulnerabilities.
Best Practice:
Enable WordPress Debug Mode when you have a problem.
Replicate the error and check the log.
Fix the issue.
Set WP_DEBUG back to false and delete the debug.log file from your server.
Conclusion
Fixing a broken website doesn’t require magic; it requires the right data. By utilizing WordPress Debug Mode, you stop guessing and start solving.
Whether you are fixing a White Screen of Death or developing a new plugin, the combination of WP_DEBUG, WP_DEBUG_LOG, and WP_DEBUG_DISPLAY ensures you can hunt down errors efficiently without disrupting the user experience.
So, the next time your site breaks, don’t panic. Open your wp-config.php, turn on WordPress Debug Mode, and get your site back on track effortlessly.