There is nothing more frustrating for a developer than logging into a client’s site to perform maintenance, only to be met with a crawling, unresponsive backend. A slow WordPress admin dashboard doesn’t just waste time; it indicates underlying server, database, or code inefficiencies that could eventually cripple the entire website. While frontend performance gets all the glory in Core Web Vitals, backend latency is the silent killer of productivity.
The good news is that backend latency is rarely a mystery. It is almost always a calculation of finite resources against inefficient code execution. In this guide, we will move beyond generic advice like “deactivate your plugins” and dive into the technical architecture of the dashboard. We will pinpoint exactly why you are experiencing a slow WordPress admin and provide the specific PHP snippets, WP-CLI commands, and database queries needed to fix it permanently.
Prerequisites
Before attempting the advanced database operations and code modifications below, ensure your environment meets the following baseline requirements. Failure to prepare can lead to data loss or critical fatal errors.
- Backup Required: A full backup of the database and files (use WP-CLI or a staging environment).
- PHP Version: PHP 8.0 or higher is recommended for optimal execution time.
- Access Level: FTP/SFTP access and phpMyAdmin or terminal access for WP-CLI.
- Permissions: Administrator level access to the WordPress dashboard.
Backup Required
Step 1: Diagnose Bottlenecks with Query Monitor
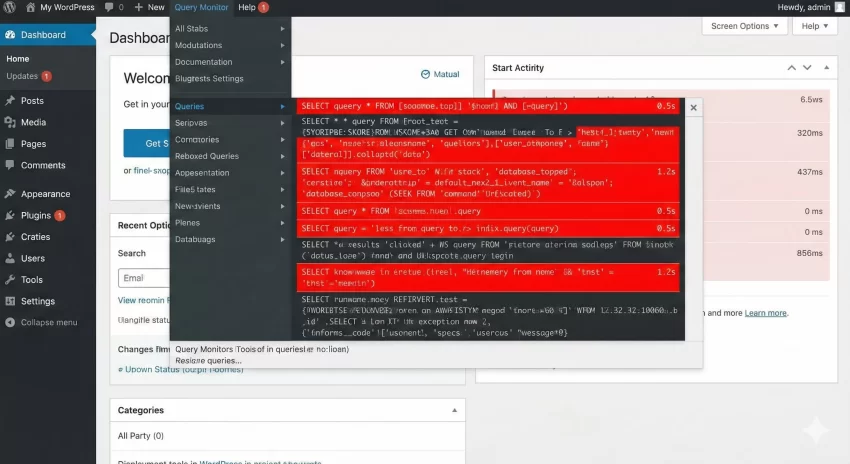
You cannot fix what you cannot measure. The first step in troubleshooting a slow WordPress admin is to identify specifically what is slow. Is it a PHP script timing out? Is it a slow MySQL query? Or is it an external HTTP API request blocking the page load? The Query Monitor plugin is the standard tool for this analysis.
Once installed, Query Monitor adds an overlay to your admin bar. When you navigate to a sluggish page, the dropdown will highlight slow queries in red. For developers, the “Queries by Component” feature is invaluable. It groups database calls by plugin or theme, allowing you to instantly isolate the specific culprit causing the slow WordPress admin experience.
Analyzing Slow SQL Queries
Open the Query Monitor panel and navigate to the “Queries” tab. Look for queries taking longer than 0.05s. In a typical WordPress admin environment, you might see WP_Query running efficient loops, but poorly coded plugins often run SELECT * on large tables without limits. If a specific plugin is generating hundreds of duplicate queries (N+1 problem), it is the primary cause of your latency.
Checking HTTP API Calls
WordPress frequently makes external calls to check for theme updates, plugin licenses, or RSS feeds. If the external server is down or slow, your admin panel will hang until that request times out. Check the “HTTP API Calls” section in Query Monitor. If you see timeouts here, you may need to block these requests using the snippet below.
/**
 * Block external HTTP requests in WP Admin to debug performance.
 * Use pnet_ prefix to avoid conflicts.
 */
function pnet_block_external_requests( $pre, $args, $url ) {
    // Only run in admin and exclude localhost
    if ( is_admin() && strpos( $url, 'api.wordpress.org' ) === false ) {
        return new WP_Error( 'http_request_failed', 'External requests blocked for debugging.' );
    }
    return $pre;
}
add_filter( 'pre_http_request', 'pnet_block_external_requests', 10, 3 );
Step 2: Clean Autoloaded Options and Transients
One of the most technical and common causes of a slow WordPress admin is a bloated wp_options table. Specifically, “autoloaded” options. WordPress loads every row in wp_options where autoload = 'yes' on every single page load. If old plugins left behind megabytes of data, or if transients aren’t expiring correctly, your server memory fills up before the dashboard even renders.
Transients are temporary data cached in the database. Theoretically, they expire and disappear. In reality, cron jobs fail, and expired transients clog your database. We will use SQL to identify and clean these efficiently.
Check Autoloaded Data Size
Run the following SQL query in phpMyAdmin. A healthy WordPress site should generally have less than 1MB of autoloaded data. If you see values exceeding 3MB or 5MB, this is definitively causing your lag.
SELECT SUM(LENGTH(option_value)) as autoload_size
FROM wp_options
WHERE autoload = 'yes';
Remove Expired Transients
While you can use optimization plugins, as a developer, you should be comfortable running a direct cleanup command. This SQL command deletes all transients that have expired but remain in the database. Clearing these often drastically reduces the weight of the wp_options table, alleviating the slow WordPress admin pressure.
DELETE FROM wp_options
WHERE option_name LIKE ('_transient_%')
OR option_name LIKE ('_site_transient_%');
Intermediate Tip
delete_option() in a one-time maintenance script. Step 3: Regulate the WordPress Heartbeat API
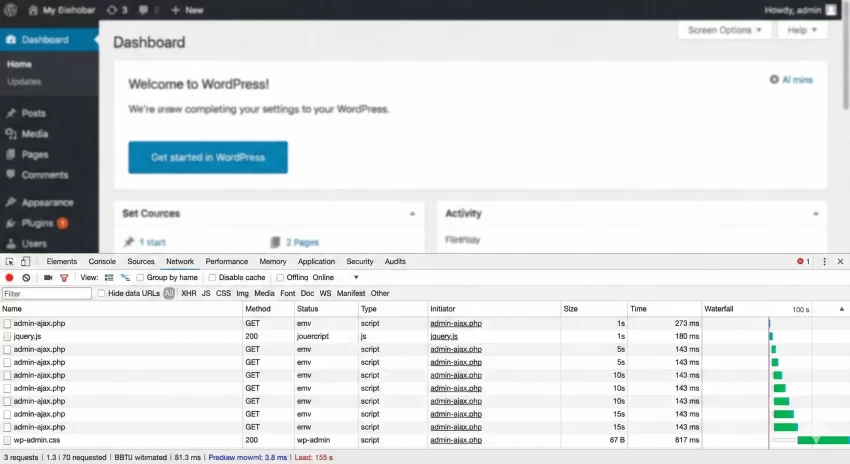
The WordPress Heartbeat API facilitates real-time communication between the browser and the server. It handles features like autosaving posts, locking posts when another editor is working, and dashboard notifications. By default, it pulses every 15 to 60 seconds. If you have multiple tabs open or multiple admins working, this creates a DDoS-like effect on your own server (specifically admin-ajax.php), leading to a slow WordPress admin.
Disabling it entirely can break autosave features, so the best approach for developers is to modify the frequency. We can slow the heartbeat down to 60 seconds or disable it entirely on dashboard pages where it is not strictly necessary (like the plugins list or settings pages).
Modifying Heartbeat Frequency
Use the following code snippet to limit the Heartbeat API. This hook allows you to set the interval to 60 seconds, which reduces server load by 4x compared to the standard 15-second pulse.
/**
 * Modify Heartbeat interval to 60 seconds to reduce server load.
 */
function pnet_slow_heartbeat( $settings ) {
    $settings['interval'] = 60;
    return $settings;
}
add_filter( 'heartbeat_settings', 'pnet_slow_heartbeat' );
Step 4: Implement Persistent Object Caching
If you are serious about fixing a slow WordPress admin, you must look beyond page caching. Page caching (like WP Rocket) only speeds up the frontend. The backend is dynamic and cannot be fully cached. However, database queries can be cached using Persistent Object Caching (Redis or Memcached).
Without Object Caching, every time you load the Posts list, WordPress queries the database to count comments, check categories, and fetch author metadata. With Redis, the result of that first query is stored in memory. The next time you load the page, the data is served from RAM in milliseconds, bypassing MySQL entirely.
Integrating Redis
Most modern managed WordPress hosts (Cloudways, Kinsta, WP Engine) offer Redis as a one-click addon. Once enabled on the server, you need a drop-in plugin to connect WordPress to the Redis instance. The Redis Object Cache plugin is the industry standard. Once connected, monitor the “Hit Ratio.” A high hit ratio means your database is breathing easier.
Pro Tip
Step 5: Increase PHP Memory Limit and Max Execution Time
Sometimes the issue isn’t code efficiency, but raw resource starvation. The WordPress admin panel is resource-intensive, especially when generating reports, processing images, or running backups. If your PHP memory limit is set to the default 40MB or even 128MB, scripts will struggle to complete, swapping to disk and causing a slow WordPress admin interface.
As a developer, you should define these constants explicitly in wp-config.php. Do not rely on the hosting provider’s defaults if they are too low. We recommend a minimum of 256MB for standard sites and 512MB for WooCommerce or membership sites.
Updating wp-config.php
Add the following lines before the “That’s all, stop editing” line in your wp-config.php file. This forces WordPress to utilize the available RAM.
define( 'WP_MEMORY_LIMIT', '512M' );
define( 'WP_MAX_MEMORY_LIMIT', '512M' );
define( 'WP_DEBUG', false ); // Ensure debug is off in production
Verifying with PHP Info
After updating the config, verify the change. You can create a temporary file named info.php with inside it. Navigate to this file in your browser and search for memory_limit. If it still shows the old value, your host might be overriding your changes via php.ini or .user.ini. In that case, you will need to contact support or edit the user INI file directly.
Common Errors & Troubleshooting
Even after applying these fixes, you might encounter stubborn issues. Here are common errors related to slow WordPress admin troubleshooting.
White Screen of Death (WSOD)
If increasing the memory limit causes a WSOD, you likely exhausted the physical RAM of your server VPS. Check your server logs (error.log). You may need to upgrade your VPS plan.
High CPU on admin-ajax.php
If your server logs show high CPU usage specifically on admin-ajax.php, it is almost certainly a plugin abusing the Heartbeat API or a frontend element making Ajax calls. Use the Heartbeat control step above, or audit your plugins one by one.
Redis Connection Exceptions
If installing Redis breaks your site, verify the port and password in wp-config.php. Localhost usually uses port 6379, but enterprise hosting often uses custom sockets.
Summary
Troubleshooting a slow WordPress admin dashboard requires a systematic approach. By identifying database bottlenecks with Query Monitor, cleaning up autoloaded data, regulating the Heartbeat API, and leveraging Redis, you can transform a sluggish backend into a high-performance workspace. Remember, a fast backend is not just a luxury for you; it ensures that cron jobs, order processing, and content management happen efficiently.
Don’t let a slow WordPress admin hinder your development workflow. Implement these technical fixes today and enjoy a snappier, more robust WordPress experience.